sensortoolkit Data Formatting Scheme (SDFS)
Sensor and reference data are often presented in a wide range of formats. This can present challenges when analyzing datasets, as differences in formatting may require different scripting approaches. Converting both sensor and reference datasets into a common formatting standard allows for ease of use in accessing and analyzing these datasets.
The sensortoolkit Data Formatting Scheme (SDFS) presents a formatting standard for displaying and cataloging collocated datasets for air sensors and reference measurements. SDFS is intended for use with timeseries datasets recorded via continuous monitoring at a configuring sampling frequency, whereby a timestamp is logged for each consecutive measurement.
Note
Sensor and reference datasets are automatically converted into the SDFS format after running the setup modules for both sensor and reference. For more information on these setup modules, please see AirSensor Setup for more information about importing and processing sensor data and ReferenceMonitor Setup for more information on importing and processing reference monitor data.
SDFS datasets for sensor and reference measurements differ slightly, however,
all SDFS datasets share a common organizational structure. The dataset index,
named DateTime, is a timeseries index containing successive timestamps in
ISO 8601 format.
Timestamps and corresponding measurement entries are presented in ascending
format (i.e., the head of datasets display the oldest entries, and
the tail of datasets contain the newest entries).
Quantities that are measured by an air sensor or reference monitor continuously and at a configured sampling frequency are referred to as Parameters. These may be environmental/meteorological conditions (e.g., temperature, relative humidity, wind speed, etc.) or pollutant concentrations (PM2.5, O3, etc.). The following naming convention is used for naming columns that are associated with parameter quantities or data:
Parameter Name |
SDFS Label |
Units |
Parameter Classification |
Notes |
|---|---|---|---|---|
\(PM_{1}\) |
|
\(\mu g/m^3\) |
PM |
|
\(PM_{2.5}\) |
|
\(\mu g/m^3\) |
PM |
Criteria Pollutant |
\(PM_{10}\) |
|
\(\mu g/m^3\) |
PM |
Criteria Pollutant |
\(O_{3}\) (Ozone) |
|
Parts per billion by volume |
PM |
Criteria Pollutant |
\(NO\) (Nitric Oxide) |
|
Parts per billion by volume |
Gases |
|
\(NO_{2}\) (Nitrogen Dioxide) |
|
Parts per billion by volume |
Gases |
Criteria Pollutant |
\(NO_{x}\) (Nitrogen Oxides) |
|
Parts per billion by volume |
Gases |
|
\(SO_{2}\) (Sulfur Dioxide) |
|
Parts per billion by volume |
Gases |
Criteria Pollutant |
\(SO_{x}\) (Sulfur Dioxides) |
|
Parts per billion by volume |
Gases |
|
\(CO\) (Carbon Monoxide) |
|
Parts per billion by volume |
Gases |
Criteria Pollutant |
Relative Humidity |
|
Percent |
Met |
|
Temperature |
|
Degrees Celsius |
Met |
|
Dew point |
|
Degrees Celsius |
Met |
If internal Temp and RH measured, but not DP, |
Wind Speed |
|
Meters/second |
Met |
|
Wind Direction |
|
Radians |
Met |
|
Pressure |
|
Met |
||
Parameter Units |
|
Ancillary |
Parameter Metadata |
|
Parameter QC Code |
|
N/a |
Ancillary |
Parameter Metadata |
Latitude of sensor |
|
Decimal degrees |
Ancillary |
Siting Metadata |
Longitude of sensor |
|
Decimal degrees |
Ancillary |
Siting Metadata |
Parameter data normalized |
|
N/a |
Eval |
Calculated during sensor evaluation analysis |
For each parameter, data for measured quantities are organized into a column
labeled [parameter]_Value (where parameter is the name given to the parameter
in the table listed above).
Alongside parameter values, an immediately adjacent column displays the units of
measure for the parameter, labeled [parameter]_Unit.
Columns containing information for a particular parameter are grouped together, so that visually, datasets containing multiple parameters are depicted in the following way:
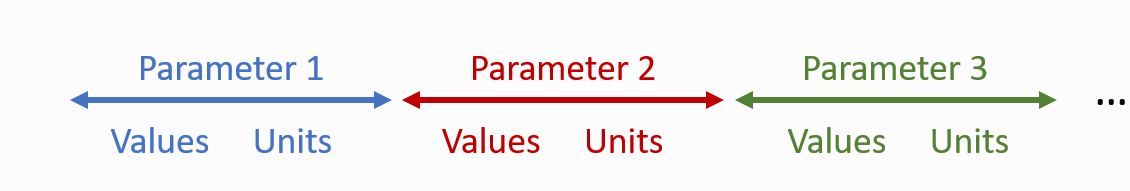
Grouping of parameter columns in SDFS datasets.
A noted previously, reference datasets differ slightly in their presentation. Specifically, in addition to parameter columns for measurement values and units, other parameter metadata columns are included. This includes information about quality control flags and a description of the reference method used to collect the parameter measurements. Below is a list of parameter columns included in reference datasets:
Column name |
Description |
|---|---|
|
Parameter measurement recorded by device |
|
Parameter units of measure |
|
Quality assurance/quality control flags assigned either by the agency |
|
Air Quality System (AQS) parameter code |
|
FRM/FEM instrument name |
|
Air Quality System (AQS) method code for FRM/FEM |
|
Method parameter occurrence code (May be > 1 if multiple FRM/FEM |
In addition to the timestamp index and parameter columns discussed above, further columns are included in SDFS datasets detailing information about the location of the sensor or reference monitor. Measurements are assumed to be collected at an ambient, outdoor, fixed site monitoring station, and the following columns are included for cataloging these siting attributes:
Column name |
Description |
|---|---|
|
Agency overseeing the ambient air monitoring site and FRM/FEM |
|
Name of the ambient air monitoring site |
|
The Air Quality System site identifier (AQS ID), if applicable |
|
The latitude of the monitoring site |
|
The longitude of the monitoring site |
|
The reference data service used to acquire data |
|
The date and time that data were downloaded or acquired locally |
Example SDFS Datasets
Sensor SDFS Dataset
DateTime |
PM25_Value |
PM25_Unit |
O3_Value |
O3_Unit |
NO2_Value |
NO2_Unit |
Temp_Value |
Temp_Unit |
RH_Value |
RH_Unit |
DP_Value |
DP_Unit |
DP_Calculated_Value |
DP_Calculated_Unit |
Normalized_PM25_Value |
Normalized_PM25_Units |
|---|---|---|---|---|---|---|---|---|---|---|---|---|---|---|---|---|
2019-08-01 12:00:00+00:00 |
5.79 |
Micrograms per Cubic Meter |
10.7 |
Parts per Billion |
-2.64 |
Parts per Billion |
26.1 |
Degrees Celsius |
89.12 |
Percent |
24.14 |
Degrees Celsius |
24.16 |
Degrees Celsius |
0.63 |
None |
2019-08-01 13:00:00+00:00 |
7.33 |
Micrograms per Cubic Meter |
23.89 |
Parts per Billion |
-12.47 |
Parts per Billion |
30.53 |
Degrees Celsius |
70.67 |
Percent |
24.56 |
Degrees Celsius |
24.6 |
Degrees Celsius |
0.81 |
None |
2019-08-01 14:00:00+00:00 |
8.4 |
Micrograms per Cubic Meter |
40.13 |
Parts per Billion |
-17.27 |
Parts per Billion |
34.25 |
Degrees Celsius |
59.75 |
Percent |
25.27 |
Degrees Celsius |
25.3 |
Degrees Celsius |
0.83 |
None |
2019-08-01 15:00:00+00:00 |
10.05 |
Micrograms per Cubic Meter |
55.87 |
Parts per Billion |
-20.84 |
Parts per Billion |
36.73 |
Degrees Celsius |
50.22 |
Percent |
24.67 |
Degrees Celsius |
24.69 |
Degrees Celsius |
0.82 |
None |
2019-08-01 16:00:00+00:00 |
12.03 |
Micrograms per Cubic Meter |
61.14 |
Parts per Billion |
-15.42 |
Parts per Billion |
37.62 |
Degrees Celsius |
47.04 |
Percent |
24.4 |
Degrees Celsius |
24.41 |
Degrees Celsius |
0.87 |
None |
Reference SDFS Dataset
DateTime |
PM25_Value |
PM25_Unit |
PM25_QAQC_Code |
PM25_Param_Code |
PM25_Method |
PM25_Method_Code |
PM25_Method_POC |
Agency |
Site_Name |
Site_AQS |
Site_Lat |
Site_Lon |
Data_Source |
Data_Acquisition_Date_Time |
|---|---|---|---|---|---|---|---|---|---|---|---|---|---|---|
2019-08-01 05:00:00+00:00 |
9.9 |
Micrograms per Cubic Meter |
0 |
88101 |
T-API T640X at 16.67 LPM |
238 |
1 |
OAQPS |
Burdens Creek |
37-063-0099 |
35.89 |
-78.87 |
AirNowTech |
10/21/2021 9:47 |
2019-08-01 06:00:00+00:00 |
10.4 |
Micrograms per Cubic Meter |
0 |
88101 |
T-API T640X at 16.67 LPM |
238 |
1 |
OAQPS |
Burdens Creek |
37-063-0099 |
35.89 |
-78.87 |
AirNowTech |
10/21/2021 9:47 |
2019-08-01 07:00:00+00:00 |
10.4 |
Micrograms per Cubic Meter |
0 |
88101 |
T-API T640X at 16.67 LPM |
238 |
1 |
OAQPS |
Burdens Creek |
37-063-0099 |
35.89 |
-78.87 |
AirNowTech |
10/21/2021 9:47 |
2019-08-01 08:00:00+00:00 |
10.5 |
Micrograms per Cubic Meter |
0 |
88101 |
T-API T640X at 16.67 LPM |
238 |
1 |
OAQPS |
Burdens Creek |
37-063-0099 |
35.89 |
-78.87 |
AirNowTech |
10/21/2021 9:47 |
2019-08-01 09:00:00+00:00 |
10.5 |
Micrograms per Cubic Meter |
0 |
88101 |
T-API T640X at 16.67 LPM |
238 |
1 |
OAQPS |
Burdens Creek |
37-063-0099 |
35.89 |
-78.87 |
AirNowTech |
10/21/2021 9:47 |