Creating Testing Reports - The PerformanceReport Class
Creating testing reports with sensortoolkit.PerformanceReport is very similar to using
the sensortoolkit.SensorEvaluation class. Users pass the same attributes to the
PerformanceReport class as they do to conduct analysis with SensorEvaluation
(PerformanceReport is an inherited class of SensorEvaluation, which means that
its initialization creates a SensorEvaluation instance and is used to construct reports).
Note that information about the testing organization and testing location can be
populated in reports via the respective sensortoolkit.presets attributes:
# Fill in bracketed placeholder text with your information
# Add information about the testing organization that conducted the evaluation
sensortoolkit.presets.test_org = {
    'testing_descrip': '[Insert name of deployment]',
    'org_name': '[Insert organization name]',
    'org_division': '[Insert organization division]',
    'org_type': '', #not needed
    'org_website': {'title': '[Insert title of website]',
                    'link': '[Insert website link]'},
    'org_contact_email': '[Insert email]',
    'org_contact_phone': '[Insert phone number]'}

# Add information about the testing location where sensors were sited
sensortoolkit.presets.test_loc = {
    'site_name': '[Insert name of site] ', #strongly recommended
    'site_address': '[Insert site address]',
    'site_lat': '[Insert site latitude]',
    'site_lon': '[Insert site longitude]',
    'site_aqs_id': '[If applicable, insert site AQS ID]'} #strongly recommended, if applicable
These dictionaries house information about the testing organization, contact information, and site details including the address, coordinates, and site AQS ID if applicable.
testing_org
A dictionary containing the information about the testing organization.
Attribute name |
Description |
|---|---|
|
The descriptive name assigned to the sensor deployment. |
|
The name of the testing organization. |
|
The organization testing division. |
|
The organization sector type. |
|
Website title and address for the testing organization. |
|
Contact email address responsible parties conducting testing. |
|
Phone number for responsible parties conducting testing. |
testing_loc
A dictionary containing information about the testing site. If the site is part of U.S. EPA’s Air Quality System (AQS), the AQS Site ID should be specified.
Attribute name |
Description |
|---|---|
|
The name of the ambient monitoring site. |
|
The street address of the monitoring site. |
|
The latitude coordinate of the site. |
|
The longitude coordinate of the site. |
|
[AQS Sites Only] The AQS site code assigned to the ambient monitoring site. |
Below is an example of running the PerformanceReport class to create a testing
report for the Toco_Toucan sensor evaluating its PM2.5 performance.
# Instantiate the PerformanceReport class for the example sensor dataset
report = sensortoolkit.PerformanceReport(sensor,
                                         pollutant,
                                         reference,
                                         write_to_file=True,
                                         figure_search=False)

# Compile the report and save the file to the reports subfolder
report.CreateReport()
Arguments passed to PerformanceReport
Attribute name |
Description |
|---|---|
|
A |
|
A |
|
A |
|
If true, evaluation statistics are saved to |
|
If true, PerformanceReport will search for figures in the |
Console Output
When the above code block is run (including both instantiation of the PerformanceReport
object report and running the PerformanceReport.create_report() method),
the following will be printed to the console.
Computing normalized PM25 values (by Teledyne Advanced Pollution Instrumentation T640X)
Computing normalized PM25 values (by Teledyne Advanced Pollution Instrumentation T640X)
Computing mean parameter values across concurrent sensor datasets
Computing mean parameter values across concurrent sensor datasets
Populating deployment dataframe with evaluation statistics
Computing CV for 1-Hour averaged PM25
..N excluded: 20 out of 733 total
..N concurrent: 713
..Concurrent measurement timeframe: 2019-08-01 12:00:00+00:00 - 2019-09-01 00:00:00+00:00
Computing CV for 24-Hour averaged PM25
..N excluded: 3 out of 32 total
..N concurrent: 29
..Concurrent measurement timeframe: 2019-08-02 00:00:00+00:00 - 2019-08-31 00:00:00+00:00
Computing 1-hour regression statistics for Toco_Toucan vs. Teledyne Advanced Pollution Instrumentation T640X
..RT01
..RT02
..RT03
Computing 1-hour regression statistics for Toco_Toucan vs. Teledyne Advanced Pollution Instrumentation T640X
..RT01
..RT02
..RT03
Computing 24-hour regression statistics for Toco_Toucan vs. Teledyne Advanced Pollution Instrumentation T640X
..RT01
..RT02
..RT03
Computing 24-hour regression statistics for Toco_Toucan vs. Teledyne Advanced Pollution Instrumentation T640X
..RT01
..RT02
..RT03
..Saving dataset to the following path: C:/Users/.../Documents/toucan_evaluation\data\eval_stats\Toco_Toucan\Toco_Toucan_PM25_vs_Teledyne_Advanced_Pollution_Instrumentation_T640X_stats_df_230209.csv
..Saving dataset to the following path: C:/Users/.../Documents/toucan_evaluation\data\eval_stats\Toco_Toucan\Toco_Toucan_PM25_vs_Teledyne_Advanced_Pollution_Instrumentation_T640X_avg_stats_df_230209.csv
Creating Testing Report for Toco_Toucan
..Adding figures to report
..creating subplot for 1 sensor with 1 row and 1 column
..creating subplot for 1 sensor with 1 row and 1 column
..Adding tabular data
[Note]: PM25 values below the Federal MDL (0.1 Micrograms per Cubic Meter) are not shown
  Computing normalized PM25 values (by FEM)
[Note]: PM25 values below the Federal MDL (0.1 Micrograms per Cubic Meter) are not shown
  Computing normalized PM25 values (by FEM)
..creating subplot for 3 sensors with 1 row and 3 columns
..creating subplot for 3 sensors with 1 row and 3 columns
..Saving report
....\reports\Toco_Toucan\PM25\Base_Testing_Report_PM25_Toco_Toucan_230209.pptx
Note
Reports are saved within the /reports folder, which is located inside the
directory pointed to by the project path.
Example Report
Below is an example report for the Toco_Toucan sensor.
Note
Sensortoolkit converts time to the UTC timezone. Graphs displayed in the report are in UTC.
Please note that at present, PerformanceReport does not populate the FRM/FEM
Instrumentation table with calibration dates, flowrate verification checks, and
any description of maintenance activities conducted on the reference instrumentation.
Users must either insert these details manually by placing information in the
provided table, or by appending documentation to the end of the report and noting on
the supplemental information page that addition documentation has been attached.
The first page of the testing report allows testers to insert information about their organization including contact information, and testers are also encouraged to provide details about the sensor and FRM/FEM instrumentation used for testing.
Various plots generated via the PerformanceReport class are displayed below
information about the deployment. These figures provide indication of the sensor’s
performance during the testing period, site conditions including temperature and
relative humidity, and meteorological influences that may be present in sensor data.

Toco Toucan Base Testing Report (Page 1)
The second page of the report includes tabular statistics, such as the performance metric values characterizing sensor vs. FRM/FEM accuracy (bias and linearity), error, and sensor-sensor (intersensor) precision.
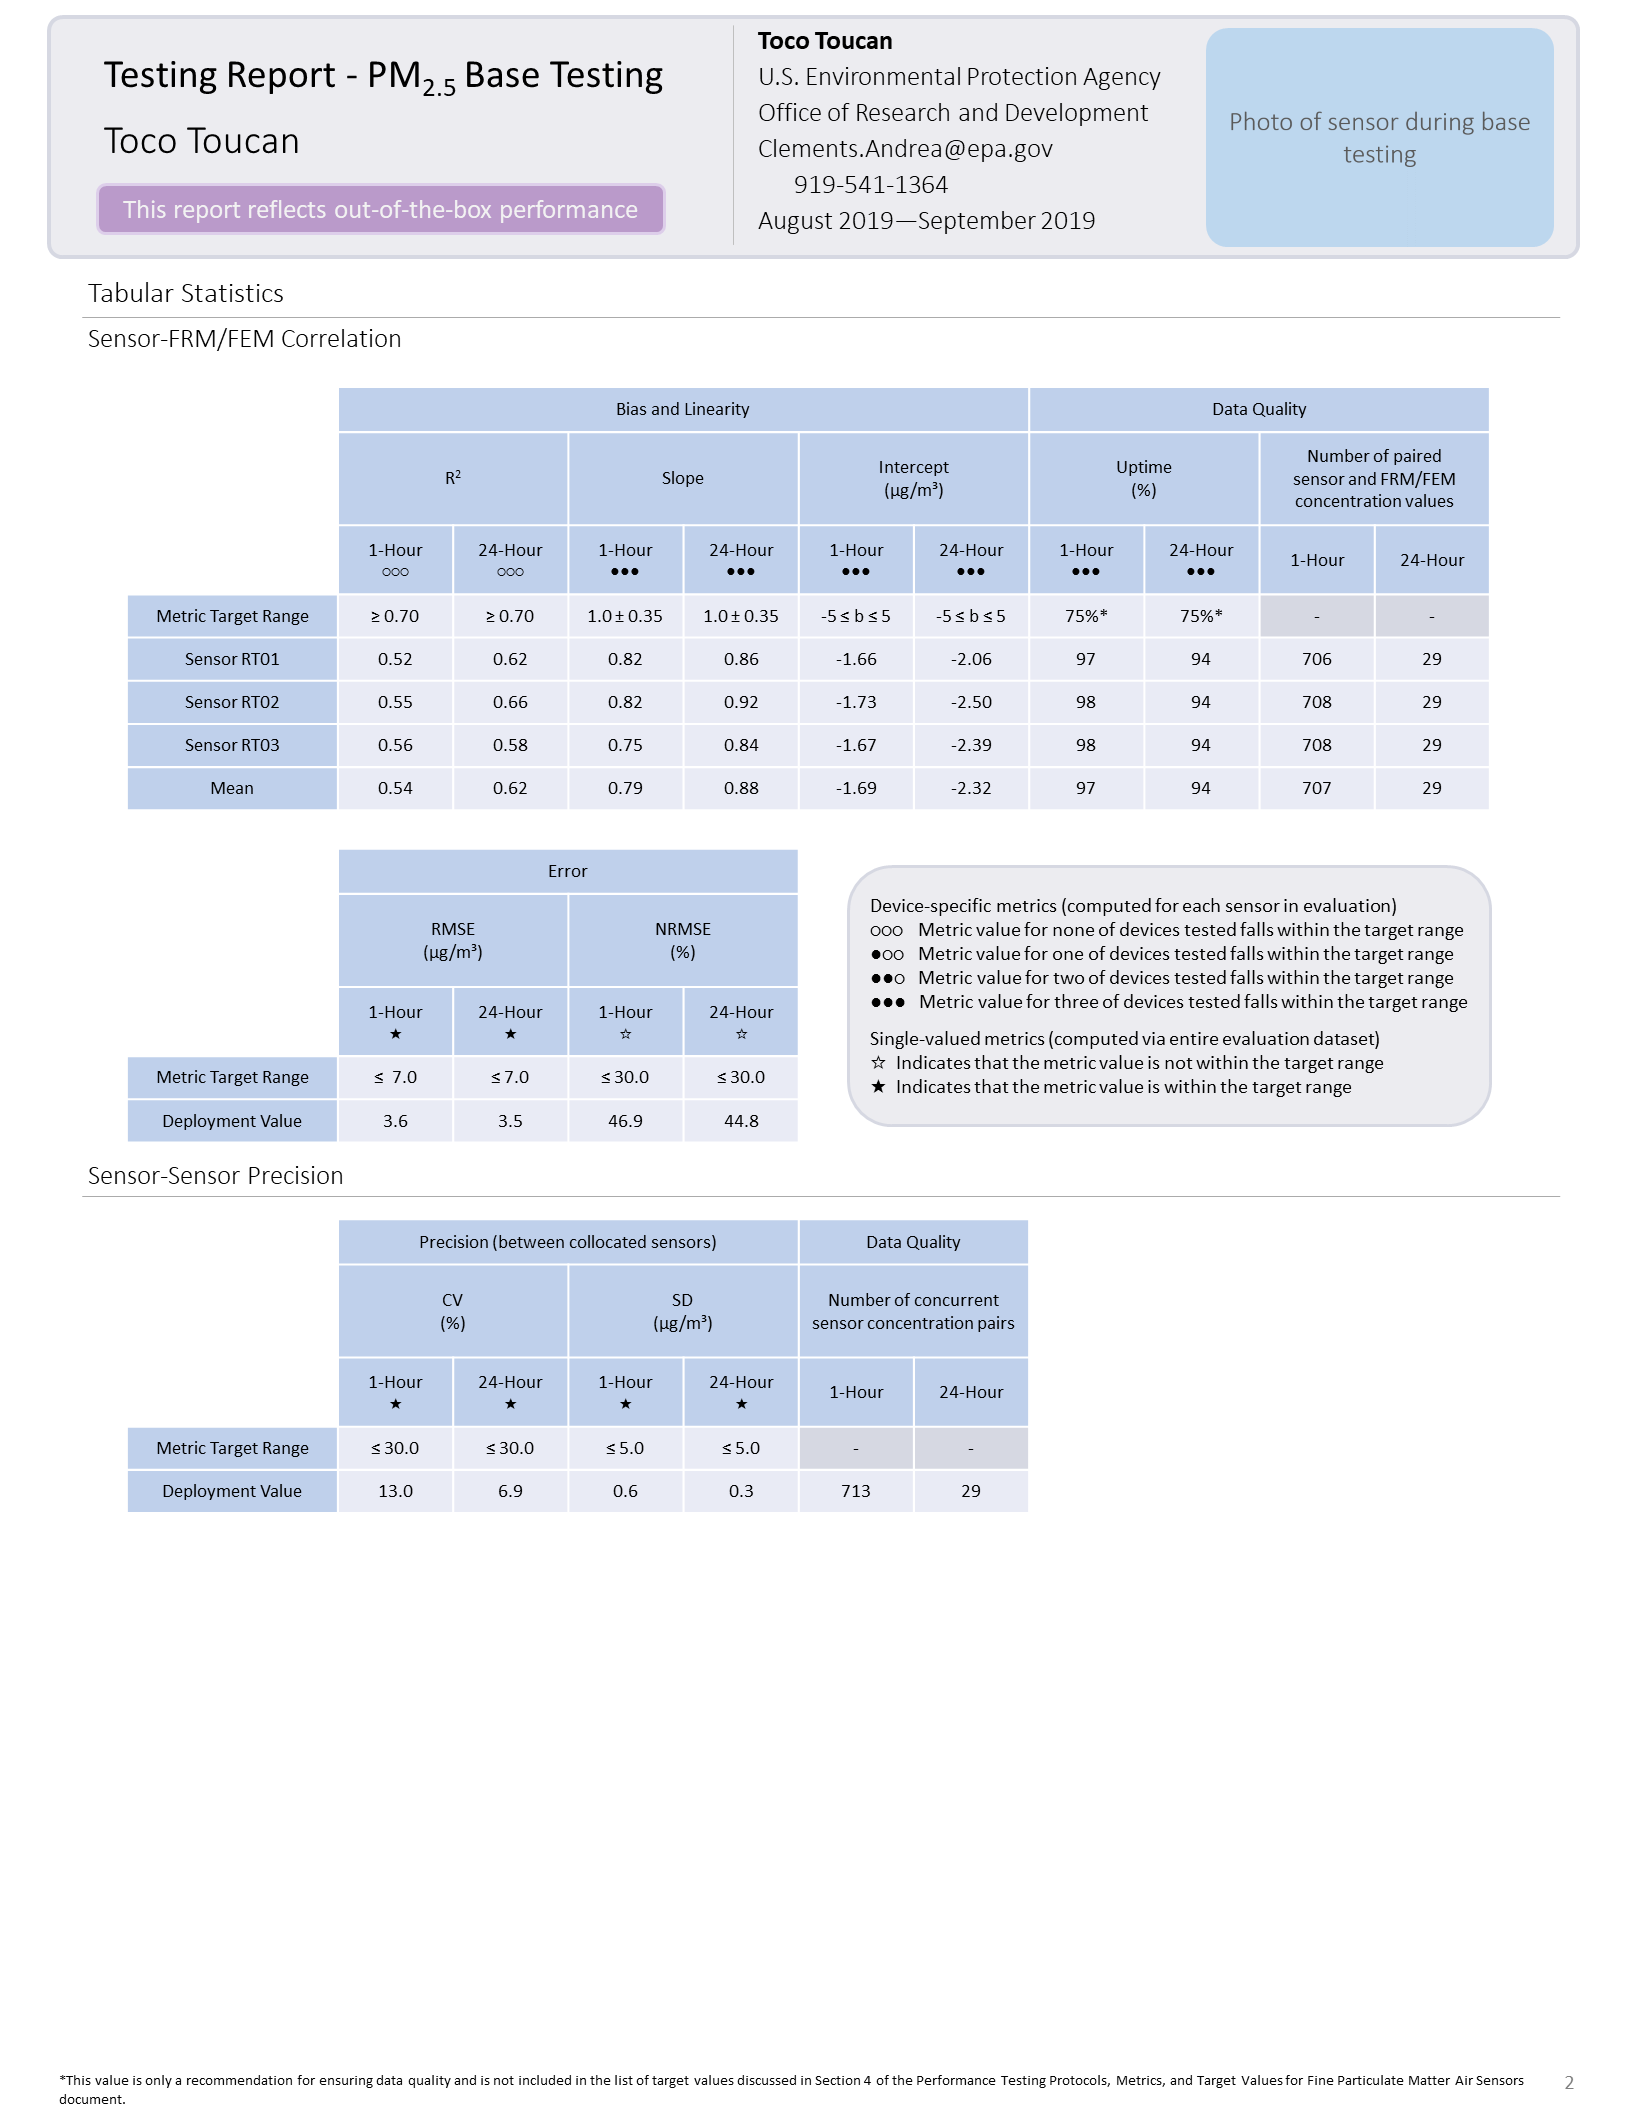
Toco Toucan Base Testing Report (Page 2)
Scatter plots for each sensor unit vs. FRM/FEM measurement pairs are displayed on a third page of the report.
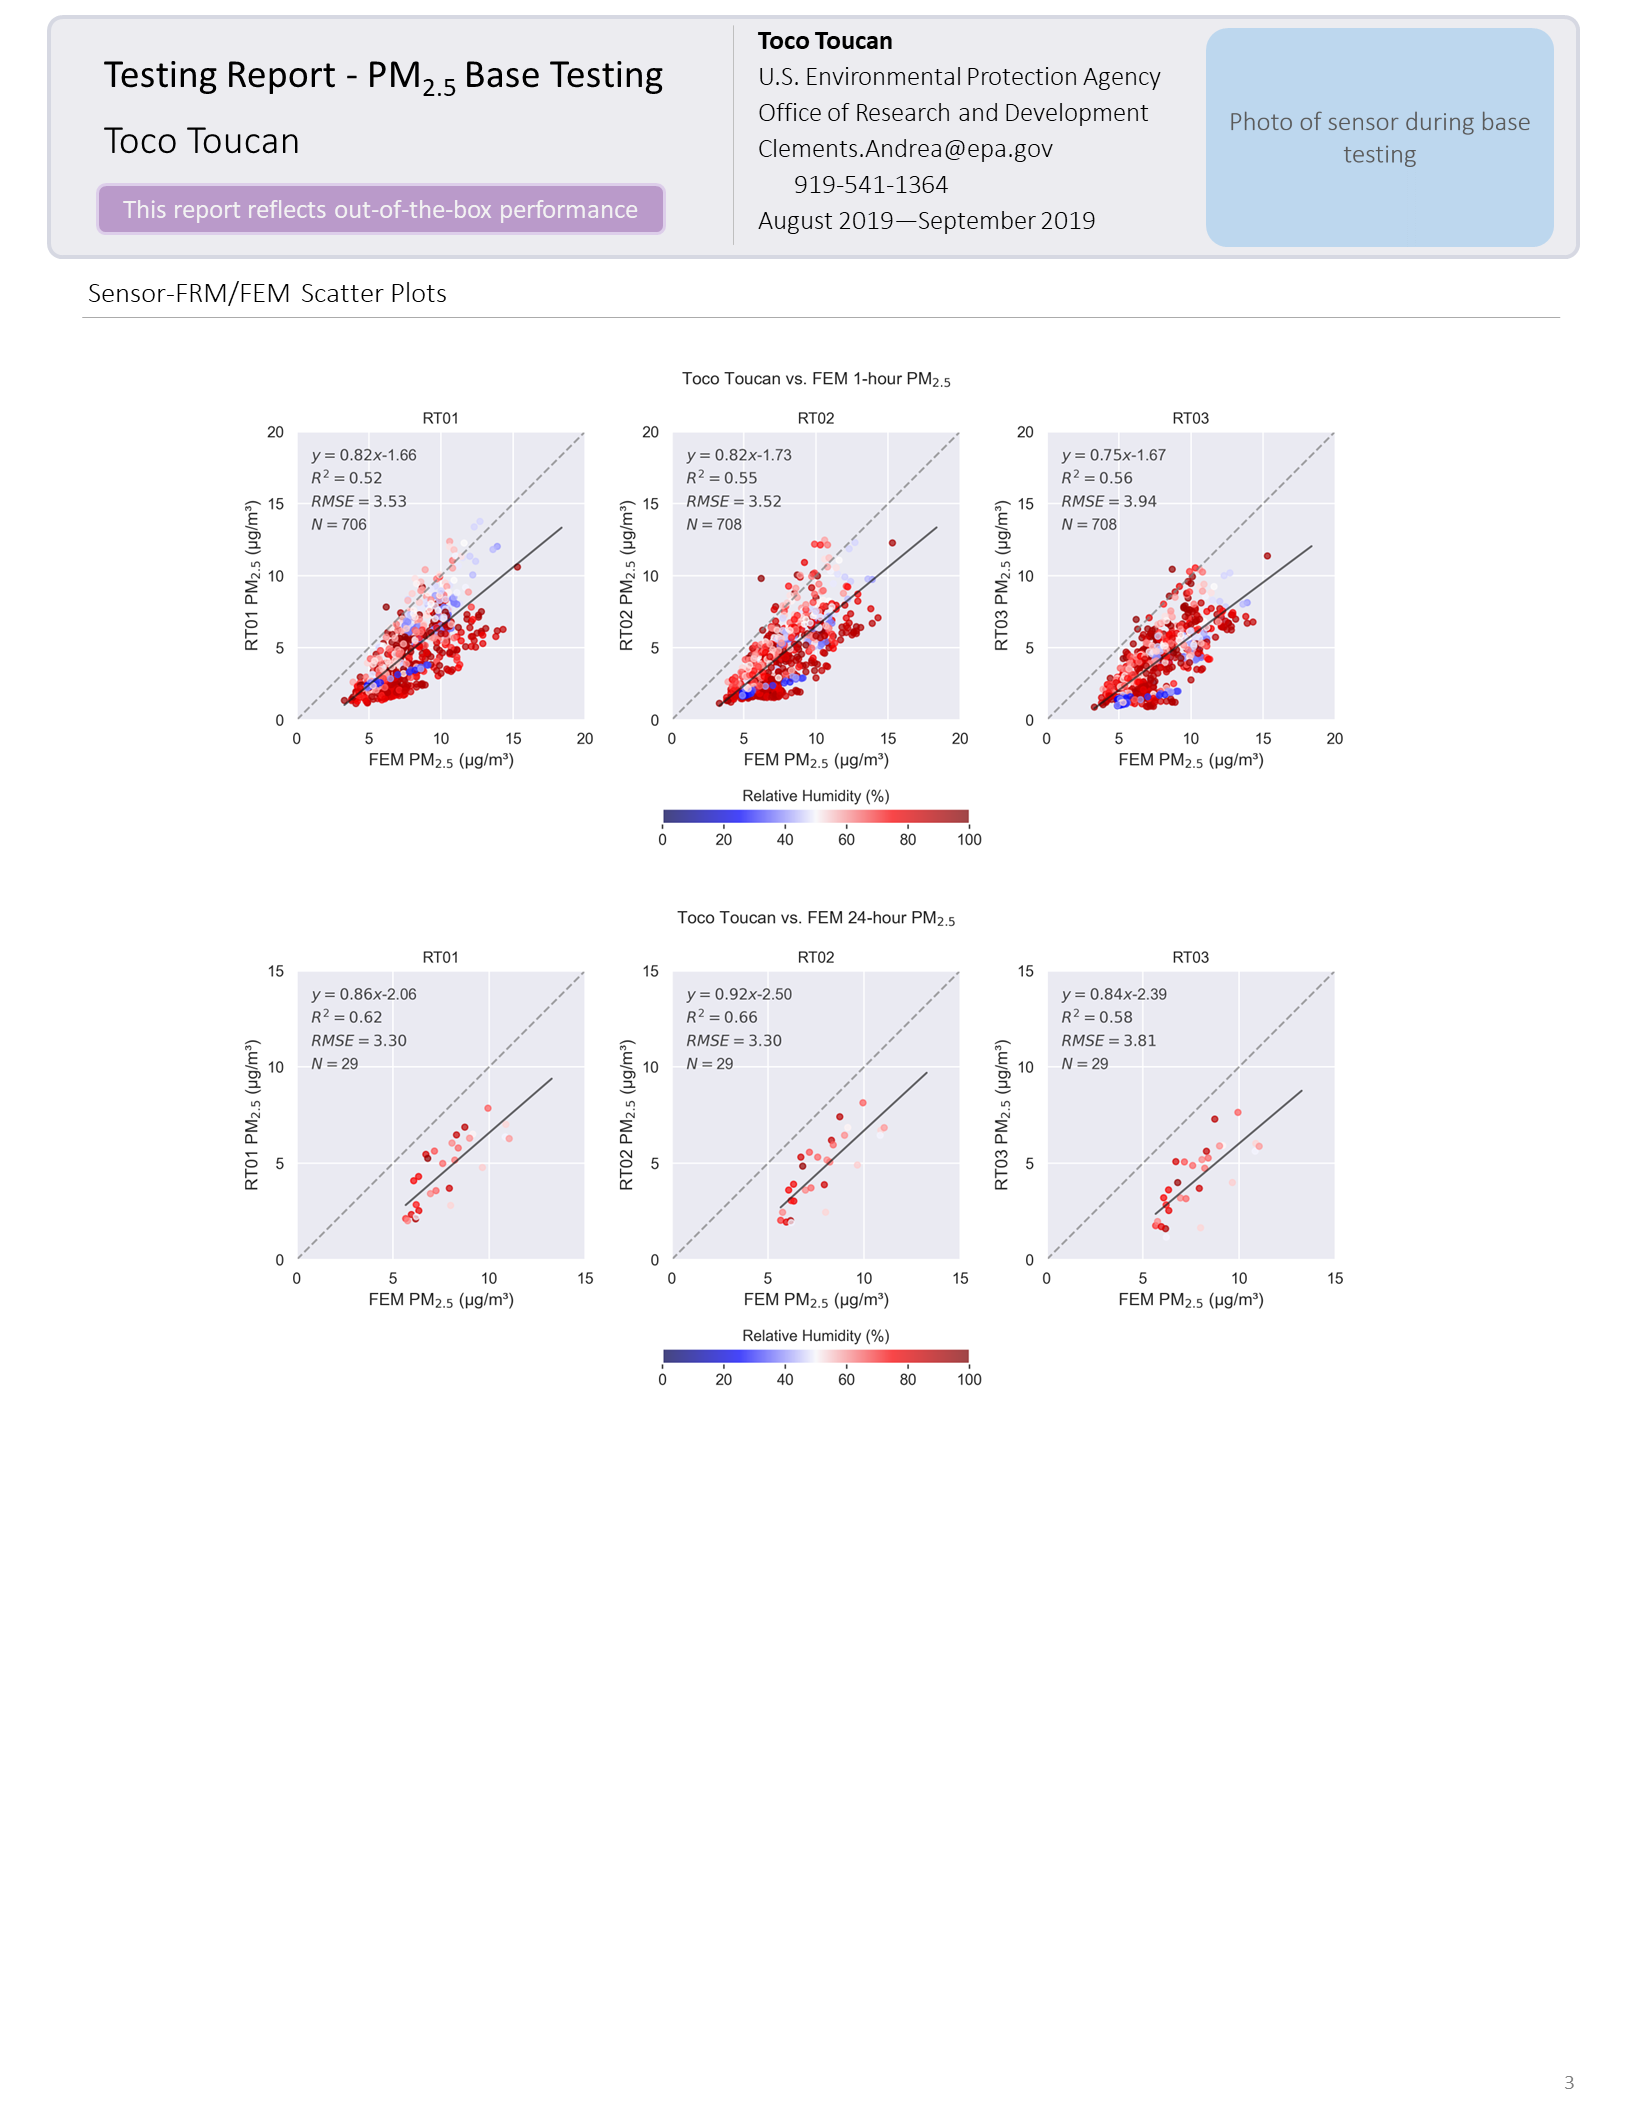
Toco Toucan Base Testing Report (Page 3)
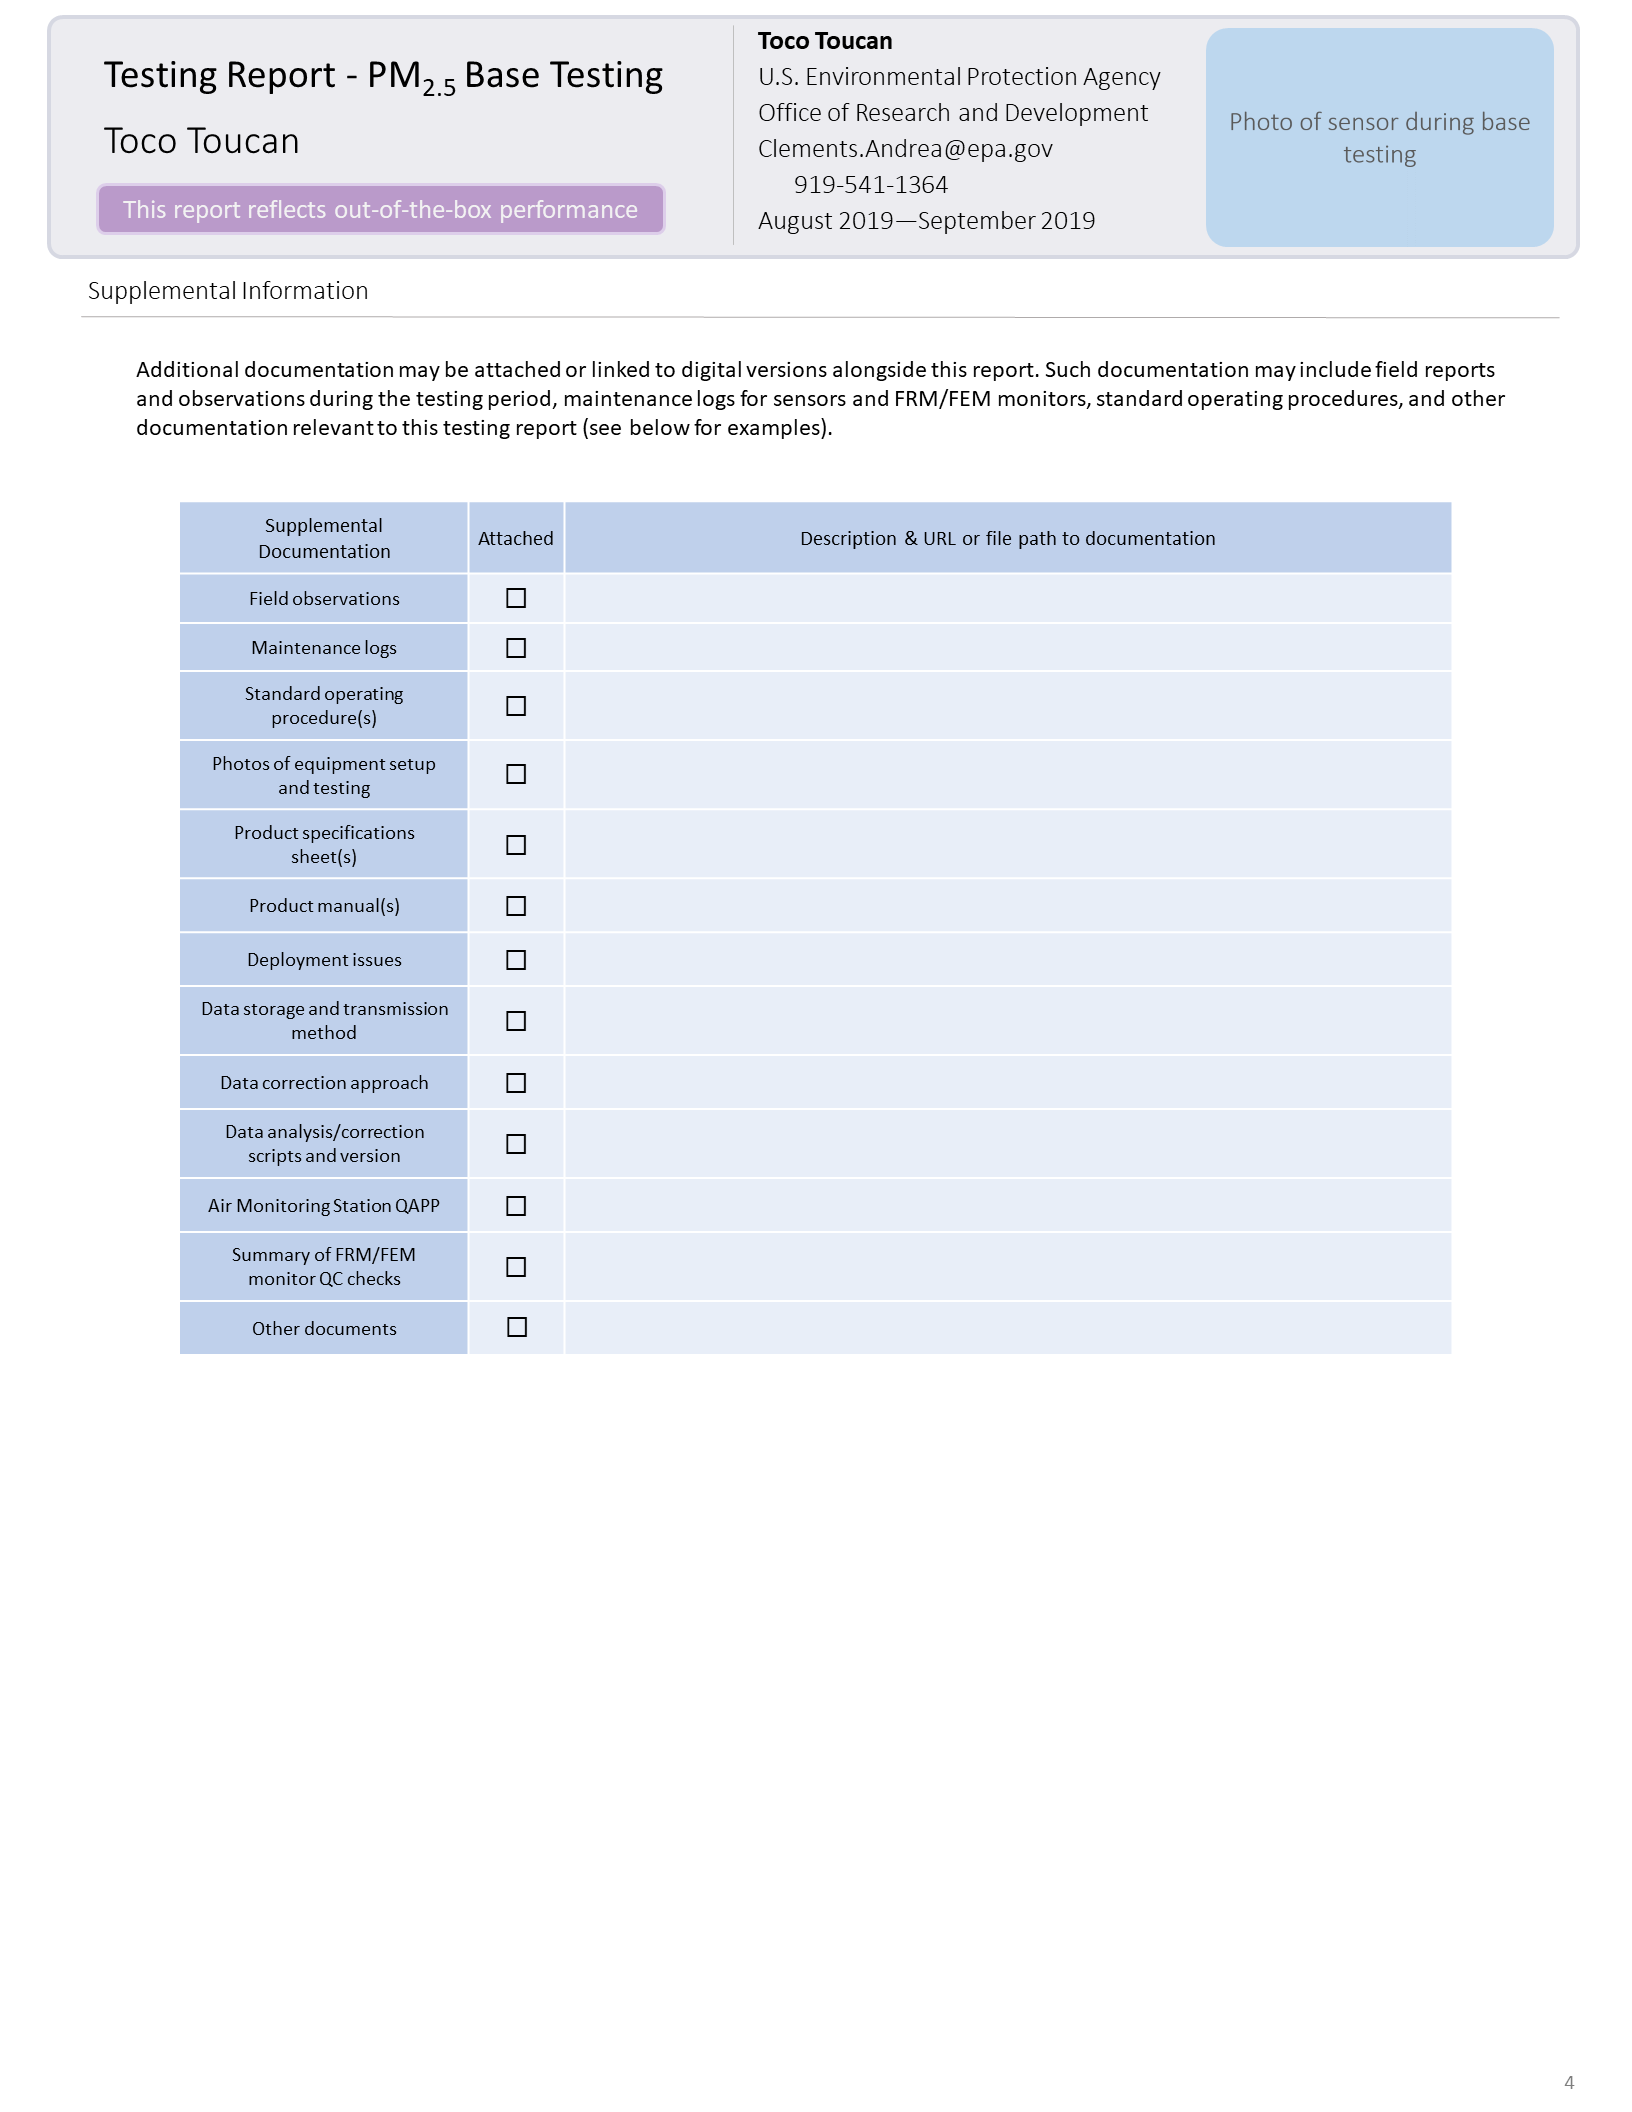
Toco Toucan Base Testing Report (Page 4)